The GNSS Receiver for Atmospheric Sounding (GRAS) is an instrument on board each MetOp spacecraft, which can track GPS signals. These signals may be used for MetOp Precise Orbit Determination (POD) and for atmospheric sounding, which is based on measuring the refraction of these signals through the Earth’s atmosphere.
The GRAS Ground Support Network (GRAS GSN) is the element providing the auxiliary data that are necessary to process the data of the GRAS instrument. This support data consists of:
-
High-rate ground tracking data of GPS spacecraft by on-ground GPS receivers globally distributed, for the generation of atmospheric sounding products.
-
GPS orbit and clock determination-related products.
-
Auxiliary files.
The GRAS GSN consists of a global network of on-ground GPS receiver stations, delivering GPS raw measurements to a Processing Centre (GSN PC), which is located at ESOC, including network connections between the receiver stations and ESOC, and from ESOC to EUMETSAT. The GSN PC is in charge of monitoring, processing, formatting, archiving and distributing the GSN products to the EPS Core Ground Segment (CGS), the European Polar System (EPS) Calibration/Validation Facility (CAL/VCAL) and the EPS GRAS Satellite Application Facility (SAF).

Atmospheric limb sounding is a rather new method for indirect measurement of temperature, pressure and water vapour in the stratosphere and the troposphere. The technique is based on utilising the radio signals continuously broadcast by the Global Navigation Satellite System (GNSS) satellites (GPS, GLONASS, and possibly others) orbiting the Earth at an altitude of about 20000 km above the surface. The GNSS radio signals are influenced both by the electron density in the ionosphere and by the temperature, pressure and water vapour in the troposphere.
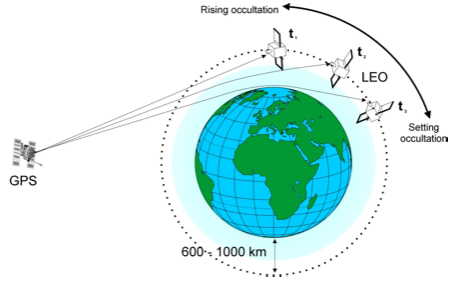
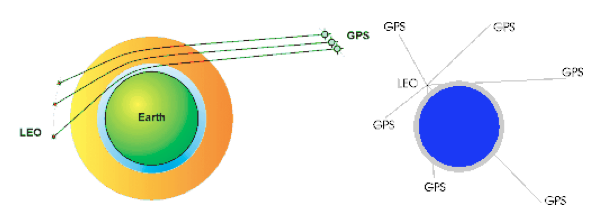
From the point of view of a Low-Earth-Orbit (LEO) satellite (at an altitude of 700-800 km) the GNSS satellites will ceaselessly rise above, or set behind, the horizon of the Earth. During these so-called “radio occultation”, where the GNSS and the LEO satellites are just able to “see” each other through the atmosphere, the GNSS signals will be slightly delayed and their ray path slightly bent on the way through the ionosphere and the troposphere. On the LEO this is observed as differences in the phase and amplitude of the received signals. The figures below show the ray paths of the GNSS signals on their way to the LEO satellite, and how the ray paths are bent during an occultation.
A typical occultation sounding will last one minute, and during this minute the LEO satellite will receive signals where the ray paths have different minimum distances to the surface, from zero up to approximately 100 km. The GNSS satellites transmit on two different frequencies, and with a receiver rate of 50 Hz this will yield around 6000 rays, making up two profiles of phase residuals up/down through the lowest 100 km of the troposphere and the ionosphere.
With precise knowledge of the position and velocity of the LEO and GNSS satellite it is possible, using geometrical considerations and inversion methods, to compute a profile of the atmospheric refractivity in the position where the individual ray path has passed closest to the Earth surface. By assumptions of hydrostatic equilibrium, the equation of state, and a simple connection between the refractive index and density of the atmosphere, a temperature and density profile can be computed in this location.
One single occultation receiver on a polar LEO satellite will receive signals from each navigation satellite up to 29 times a day. Reception of signals from all of the GPS satellites in orbit results in up to 550 atmospheric soundings each day, with an average spacing of about 1000 km. The soundings are characterised by high vertical resolution (limited by the Fresnel zone of the observation, leading to information with scale sizes less than 0.5 km) and high accuracy (around one degree Kelvin). As the measurements are absolute (basically a measurement of time) the technique needs no calibration. Moreover, the wavelengths applied make the measurement transparent to clouds and rain.

The largest error source in the observation and analysis method is the ionosphere, which is highly varying in space and time. These fluctuations have a large impact on the inversion of the observations, and knowledge of the state of the ionosphere is important for achieving good results.

